网址:https://ww2.mathworks.cn/help/signal/gs/common-periodic-waveforms-1.html
描述:本案例由2个示例构成:
-
-
针对以上案例,采用Python语言实现。
-
python
import numpy as np
import matplotlib.pyplot as plt


def rect_square_wave(origin=0, size=20,x_unit=1, y0=0, y1=1):
    d = []
    for  start in range(origin, origin + x_unit * size, x_unit):
        d.append((start, y1))
        middle = start + x_unit
        d.append((middle, y0))
        end = start + x_unit
        d.append((end, y0))

    return d

d = np.array(rect_square_wave(origin=0, size=10, x_unit=1, y0=1, y1=-1))
plt.figure(figsize=(15, 5))
plt.plot(d[:, 0], d[:, 1])
plt.show()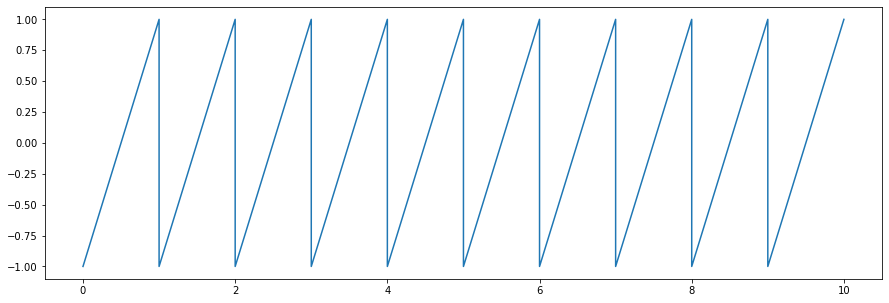
-
python
import numpy as np
import matplotlib.pyplot as plt


def rect_square_wave(origin=0, size=20, ratio=0.5, x_unit=1, y0=0, y1=1):
    d = []
    for  start in range(origin, origin + x_unit * size, x_unit):
        d.append((start, y0))
        middle = start + x_unit * ratio
        d.append((middle, y0))
        d.append((middle, y1))
        end = start + x_unit
        d.append((end, y1))

    return d

d = np.array(rect_square_wave(origin=0, size=10, ratio=0.4, x_unit=1, y0=1, y1=-1))
plt.figure(figsize=(15, 5))
plt.plot(d[:, 0], d[:, 1])
plt.show()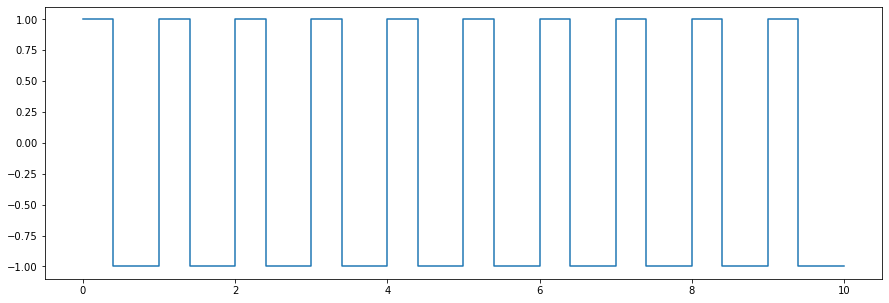
python