网址:https://ww2.mathworks.cn/help/signal/ug/align-signals-using-cross-correlation.html
描述:本案例由4个示例构成:
-
-
-
-
针对以上案例,采用Python语言实现。
-
许多测量涉及多个传感器异步采集的数据。如果您要集成信号并以关联式研究它们,您必须同步它们。
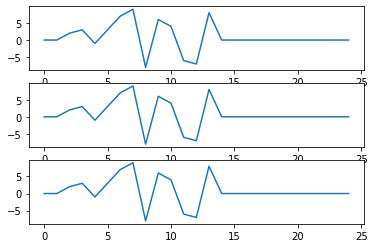
例如,假设有一辆汽车经过一座桥。它产生的振动由位于不同位置的三个相同传感器进行测量。信号有不同到达时间。
python
import numpy as np
import matplotlib.pyplot as plt

x = np.arange(0,25)
y1=[0,0,0,0,0,0,0,2,3,-1,3,7,9,-8,6,4,-6,-7,8,0,0,0,0,0,0]
y2=[0,0,2,3,-1,3,7,9,-8,6,4,-6,-7,8,0,0,0,0,0,0,0,0,0,0,0]
y3=[0,0,0,0,0,0,0,0,0,0,0,2,3,-1,3,7,9,-8,6,4,-6,-7,8,0,0]
fig = plt.figure()
ax1 = fig.add_subplot(311)
ax1.plot(x,y1)
ax1 = fig.add_subplot(312)
ax1.plot(x,y2)
ax1 = fig.add_subplot(313)
ax1.plot(x,y3)
plt.show()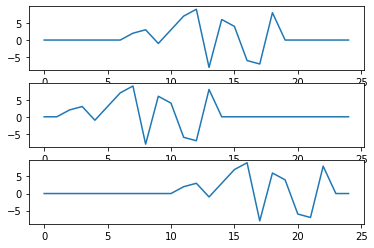
-
计算三对信号之间的互相关性。将它们归一化,使其最大值为 1。
python
cq12=np.correlate(y1,y2,'full')
cq13=np.correlate(y1,y3,'full')
cq23=np.correlate(y2,y3,'full')
c12=cq12/max(cq12)
c13=cq13/max(cq13)
c23=cq23/max(cq23)
互相关性最大值的位置指示领先或滞后时间。
python
t12=np.argmax(c12)-len(y1)+1
t13=np.argmax(c13)-len(y1)+1
t23=np.argmax(c23)-len(y2)+1
-
绘制互相关图。在每个绘图中显示最大值的位置。
python
x1 = np.arange(-len(y1)+1,len(y2))
fig = plt.figure()
ax1 = fig.add_subplot(311)
ax1.plot(x1,c12)
plt.scatter(t12,1)
plt.text(t12+1,1-0.3, 'lag:%i'%t12,fontsize=15)
ax1 = fig.add_subplot(312)
ax1.plot(x1,c13)
plt.scatter(t13,1)
plt.text(t13+1,1-0.3, 'lag:%i'%t13,fontsize=15)
ax1 = fig.add_subplot(313)
ax1.plot(x1,c23)
plt.scatter(t23,1)
plt.text(t23+1,1-0.3, 'lag:%i'%t23,fontsize=15)
plt.show()
-
通过截断具有较长延迟的向量来对齐信号。
python
y1 = y1[t12:]
y1+=([0]*t12)
y3 = y3[-t23:]
y3+=[0]*(-t23)
fig = plt.figure()
ax1 = fig.add_subplot(311)
ax1.plot(x,y1)
ax1 = fig.add_subplot(312)
ax1.plot(x,y2)
ax1 = fig.add_subplot(313)
ax1.plot(x,y3)
plt.show()