Reconstructing Missing Data
链接:
https://ww2.mathworks.cn/help/signal/ug/reconstructing-missing-data.html
python
# coding utf-8
from scipy.io import loadmat
import numpy as np
from numpy import ndarray
from scipy.interpolate import interp1d
import matplotlib.pyplot as plt
def get_data(data_path, isplot=True):
data = loadmat(data_path)
t_true = data['tTrueSignal'].squeeze()
x_true = data['xTrueSignal'].squeeze()
t_resampled = data['tResampled'].squeeze()
# 对数据进行抽取(间隔100抽样)
t_sampled = t_true[::100]
x_sampled = x_true[::100]
if isplot:
# 绘制数据对比图1
plt.figure(1)
plt.plot(t_true, x_true, '-', label='true signal')
plt.plot(t_sampled, x_sampled, 'o-', label='samples')
plt.legend()
plt.show()
return t_true, x_true, t_sampled, x_sampled, t_resampled
def data_interp(t, x, t_resampled, method_index):
if method_index == 1:
# 返回一个拟合的函数(线性插值)
fun = interp1d(t, x, kind='linear')
elif method_index == 2:
# 返回一个拟合的函数(三次样条插值)
fun = interp1d(t, x, kind='cubic')
else:
raise Exception("未知的方法索引,请检查!")
# 计算值
x_inter = fun(t_resampled)
return x_inter
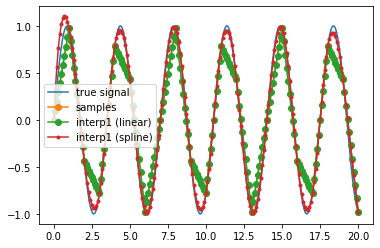
def result_visiualize(x_inter_1, x_inter_2):
# 加载数据
t_true, x_true, t_sampled, x_sampled, t_resampled = get_data("./data.mat", isplot=False)
plt.figure(2)
plt.plot(t_true, x_true, '-', label='true signal')
plt.plot(t_sampled, x_sampled, 'o-', label='samples')
plt.plot(t_resampled, x_inter_1, 'o-', label='interp1 (linear)')
plt.plot(t_resampled, x_inter_2, '.-', label='interp1 (spline)')
plt.legend()
plt.show()
if __name__ == '__main__':
# 加载数据
t_true, x_true, t_sampled, x_sampled, t_resampled = get_data("./data.mat")
# 进行插值
x_inter_1 = data_interp(t_sampled, x_sampled, t_resampled, method_index=1)
x_inter_2 = data_interp(t_sampled, x_sampled, t_resampled, method_index=2)
# 绘制图片
result_visiualize(x_inter_1, x_inter_2)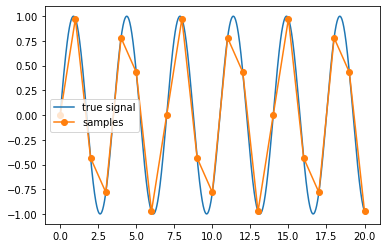
python